Power Path software solution enables generation of multiple reports, such as SAG-tension report, support report, quantity report and power line coordinates report.
In this post we will explain each part of Support report.
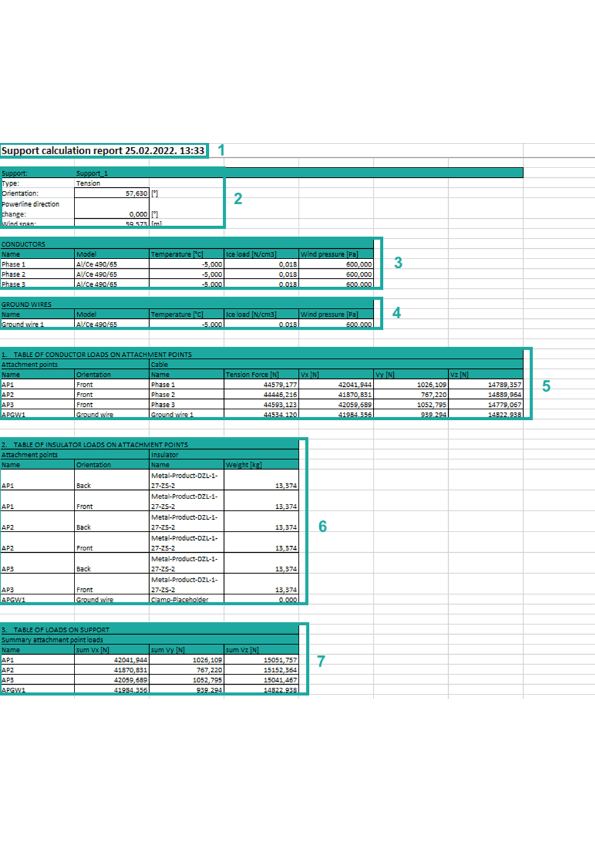
The report can be exported in .txt or .xslx file.
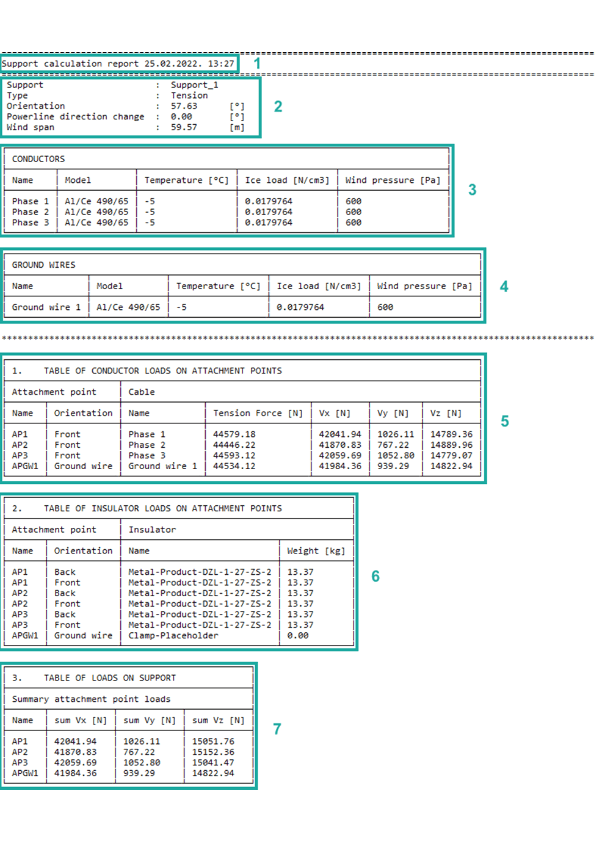
Follow the numbers for an explanation:.


1. Basic report information such as report type, the data and time when report was made.
2. Basic support information:
2.1 Support – name of support. It is the name that the user enters when adding a support (Add Support).
2.2 Type – type of support. Type can be tension and suspension (Add Support).
2.3 Orientation – orientation of support relative to the x-axis expressed in [0].
2.4 Powerline direction change – value of angle between previous and forward power line direction according to the referent tension support expressed in [0C].
2.5 Wind span – distance from two adjacent catenary lowest points.
3. Table of basic information about conductor and relevant weather condition:
3.1 Name – name of conductor. It is the name that the user enters when adding a conductor (Add Conductor).
3.2 Model – model of conductor. (Add Conductor).
3.3 Temperature – temperature of weather condition expressed in [0C]. The temperature is defined in Weather Conditions (Add Weather Conditions).
3.4 Ice load – weight per unit volume of ice expressed in [N/cm3]. The ice load factor is defined in Weather Conditions (Add Weather Conditions).
3.5 Wind pressure – pressure of wind on conductor expressed in [Pa]. The wind pressure is defined in Weather Conditions (Add Weather Conditions).
4. Table of basic information about ground wires and relevant weather condition (if user didn’t attach ground wires on power line, this table will be empty):
4.1 Name – name of ground wire. It is the name that the user enters when adding a ground wire (Add Ground Wire).
4.2 Model – model of ground wire. (Add Ground Wire).
4.3 Temperature – temperature of weather condition expressed in [0C]. The temperature is defined in Weather Conditions (Add Weather Conditions)..
4.4 Ice load – weight per unit volume of ice expressed in [N/cm3]. The ice load factor is defined in Weather Conditions (Add Weather Conditions).
4.5 Wind pressure – pressure of wind on ground wire expressed in [Pa]. The wind pressure is defined in Weather Conditions (Add Weather Conditions).
5. Table of conductor loads on attachment points.
5.1 Attachment point on support where the insulator is set:
5.1.1. Name – name of attachment point. Each predefined support has predefined attachment points located at the front and back side of the support (Add Support Data).
5.1.2 Orientation – front or back side of support (Add Support Data).
5.2 Cable includes:
5.2.1 Name – name of cable (Add Conductor).
5.2.2 Tension force – tension force on cable expressed in [N].
5.2.3 Vx – tension force by x coordinate. Vx is horizontal forces on support in x-axis direction.
5.2.4 Vy – tension force by y coordinate. Vy is horizontal forces on support in y-axis direction.
5.2.5 Vz – tension force by z coordinate. Vz is vertical forces on support in z-axis direction.
6. Table of insulator loads on attachment points.
6.1 Attachment point on support where the insulator is set:
6.1.1 Name – name of attachment point (Add Support Data).
6.1.2 Orientation – front or back side of support (Add Support Data).
6.2 Insulator set on attachment point.
6.2.1 Name – name of insulator (Add Insulator).
6.2.2 Weight [kg]– insulator weight, predetermined for each insulator (Add Insulator Data).
7. Table of summed force on attachment point.
7.1 Name – name of attachment point (Add Support Data).
7.2 sum Vx – sum of all forces by x coordinate. Vx is horizontal forces on support in local x-axis direction.
7.3 sum Vy – sum of all forces by y coordinate. Vy is horizontal forces on support in local y-axis direction.
7.4 sum Vz – sum of all forces by z coordinate. Vz is vertical forces on support in local z-axis direction.
If you want to learn how to generate Support report, visit our knowledge base – Create Support report
If you want immediately to start creating your own OHL project with the BIM approach, import your data, and use the solution for any 2D drafting and 3D modeling in technical projects, try a 30 days trial of Power Path.
