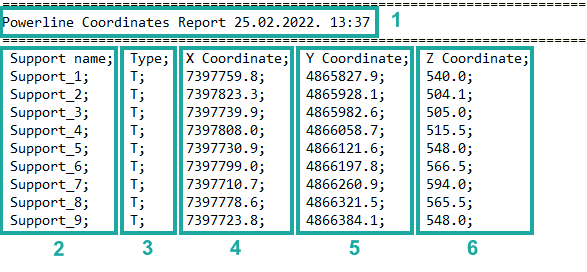
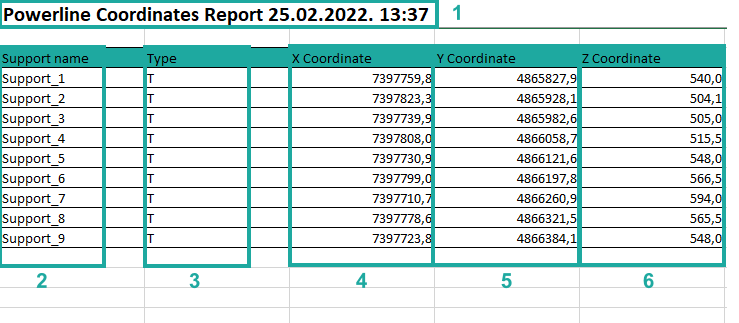
Power Path software solution enables generation of multiple reports, such as SAG-tension report, support report, quantity report and power line coordinates report.
In this post we will explain each part of Power line coordinates report.
The report can be exported in .txt or .xslx file.
Follow the numbers for an explanation:


1. Basic report information such as report type, the data and time when report was made.
2. Support name – name of support. It is the name that the user enters when adding a support (Add Support).
3. Type – type of support. T represents tension support and S represents suspension support (Add Support).
4. X Coordinate – support position by x coordinate. X coordinate is coordinate of the global coordinates system.
5. Y Coordinate – support position by y coordinate. Y coordinate is coordinate of the global coordinates system.
6. Z Coordinate – support position by z coordinate. Z coordinate is coordinate of the global coordinates system.
If you want to learn how to generate Power line coordinates report, visit our knowledge base – Create Power line coordinates report
If you want immediately to start creating your own OHL project with the BIM approach, import your data, and use the solution for any 2D drafting and 3D modeling in technical projects, try a 30 days trial of Power Path.
