In Power Path users can create several reports – SAG-tension report, support report, power line coordinates report and quantity report.
In this post, we will show you how to create a quantity report in Power Path.
To create Quantity report you need to click on the icon Create Quantity report or type PP_CREATEQUANTITYREPORT in the command line, and select power line.
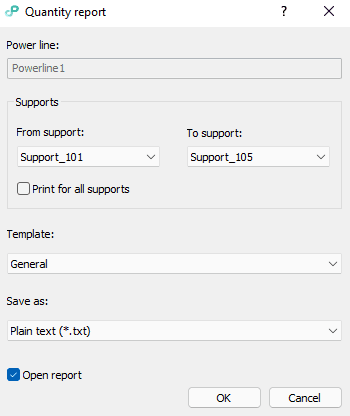
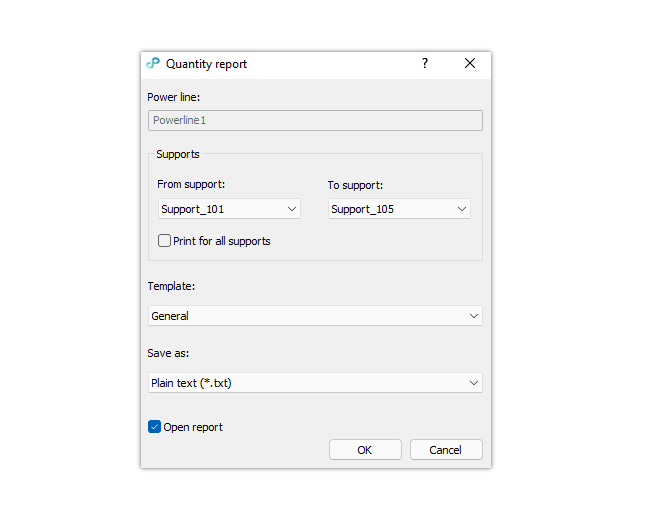
Then you need to define these parameters:
–Powerline: power line name, read-only value.
– From Support: name of the first tension support which the report will be printed from.
– To Support: name of the last tension support which the report will be printed to.
– Create for all supports checkbox: if checked the report will be generated for all Supports in the powerline.
– Template: General – general layout.
– Save As: Plain Text – .txt format. Excel Workbook – Microsoft Excel™ format.
– Open report checkbox: if checked report will be opened in the default application.
– Button OK: prints the report.
– Button Cancel: cancels the command.

Watch this video tutorial and learn how to create a quantity report:
For more details visit our Knowledge base.
If you want immediately to start creating your own OHL project with the BIM approach, import your data, and use the solution for any 2D drafting and 3D modeling in technical projects, try a 30 days trial of Power Path.

