Power Path software solution enables generation of multiple reports, such as SAG-tension report, support report, quantity report and power line coordinates report.
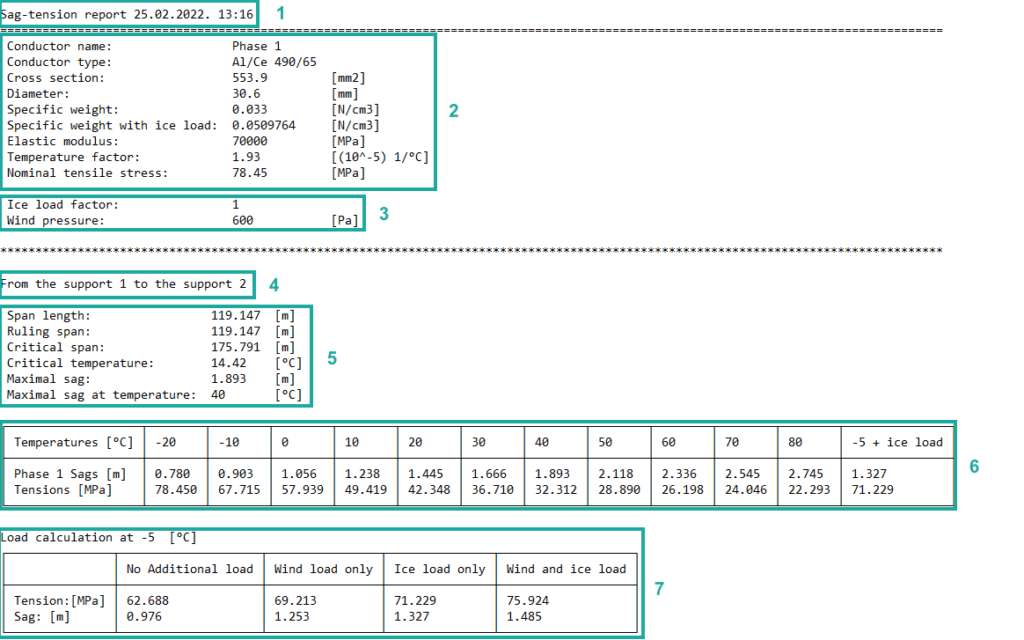
In this post we will explain each part of SAG-tension report.
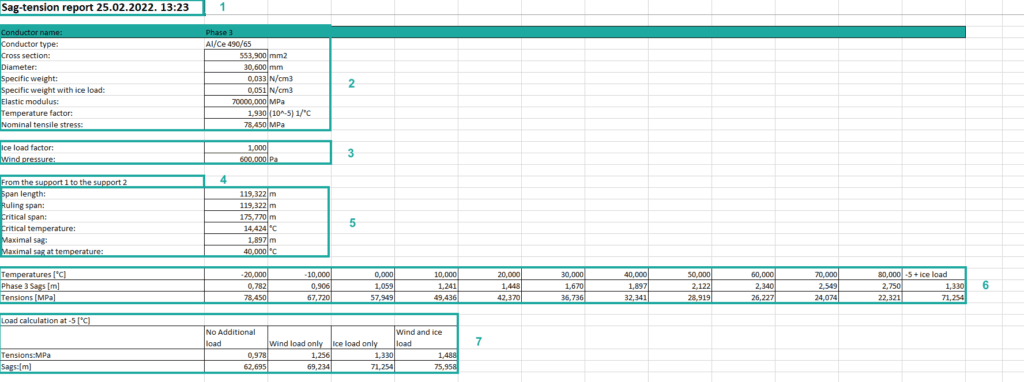
The report can be exported in .txt or .xslx file.
Follow the numbers for an explanation:.


1. Basic report information such as report type, the data and time when report was made.
2. Geometrical and mechanical characteristics of the conductor:
2.1 Conductor name – name of conductor. It is the name that the user enters when adding a conductor on power line (Add Conductor).
2.2 Conductor type – model of conductor. Name of conductor that indicates what it is made of or from which manufacturer is produced (Add Conductor Data).
2.3 Cross section – cross section of conductor expressed in [mm2]. Geometrical conductor parameter (Add Conductor Data).
2.4 Diameter – diameter of conductor expressed in [mm]. Geometrical conductor parameter (Add Conductor Data).
2.5 Specific weight – weight per unit volume of conductor expressed in [N/cm3]. Mechanical conductor parameter (Add Conductor Data).
2.6 Specific weight with ice load – weight per unit volume of conductor plus weight per unit volume of ice expressed in [N/cm3].
2.7 Elastic modulus – resistance to being deformed elastically expressed in [MPa]. Mechanical conductor parameter (Add Conductor Data).
2.8 Temperature factor – the thermal motion of individual atoms in conductor expressed in [(10-5) 1/C0]. Mechanical conductor parameter (Add Conductor Data).
2.9 Nominal tensile stress – normal permissible conductor stress expressed in [MPa]. Mechanical conductor parameter (Add Conductor Data).
3. Characteristics of weather conditions:
3.1 Ice load factor – factor of accumulated ice, which is usually with values from 1 to 5. Value may vary depending on the standards and regulations. The ice load factor is defined in Weather Conditions (Add Weather Conditions).
Additional note for ice load factor (please read and check your standard).
Some of standards define ice load factor depending on the temperature with value:
1, for the ambient temperature to -5[0C],
1.6, for the ambient temperature from -5 [0C] to -20 [0C],
2.5, for the ambient temperature from -20 [0C] to -30 [0C] and
4, for the ambient temperature below -30 [0C].
Some of standards define ice load factor depending on the thickness of the ice sheet with a density of 900 kg/m3 where the ice load factor of:
1, is for the ice thickness of 10 [mm],
1.6, is for the ice thickness of 15 [mm],
2.5, is for the ice thickness of 20 [mm] and
5, is for the ice thickness of 30 [mm].
3.2 Wind pressure – pressure of wind expressed in [Pa]. The wind pressure is defined in Weather Conditions, and it is additional load on conductor (Add Weather Conditions).
4. Names of the supports between where the conductor is attached.
5. Mechanical calculation of the indicated conductor between two supports:
5.1 Span length – the shortest horizontal distance between two supports.
5.2 Ruling span – equivalent span or mean effective span, is an assumed uniform design span. Ruling span is used to determine tensile stress.
5.3 Critical span – span where conductor tensile stress at -200C is the same as at -50C whit ice load.
5.4 Critical temperature – temperature where catenary sag is equal to the sag at -50C with ice load.
5.5 Maximal sag – point at catenary where tangent is parallel with attachment point.
5.6 Maximal sag at temperature – the temperature for which we measure the maximal sag.
6. Table of sags and tensions for different temperatures:
6.1 Temperatures [0C] – defined temperature range and step (Create Sag-Tension Report).
6.2 Sags for defined phase expressed in [m] and tensions expressed in [MPa] – for a certain temperature, this value will be calculated.
7. Table of tension and sag for different loads:
7.1 No additional load, wind load only, ice load only and wind and ice load – load on the conductor.
7.2 Tension expressed in [MPa] and sag expressed in [m] – for a certain load, this value will be calculated.
If you want to learn how to generate SAG-tension report, visit our knowledge base – Create SAG tension report
If you want immediately to start creating your own OHL project with the BIM approach, import your data, and use the solution for any 2D drafting and 3D modeling in technical projects, try a 30 days trial of Power Path.
